- All
- 3D
- Animation
- AWS Activate
- B2B
- B2C
- Bit of Both
- Blog
- Cisco
- DB Culture
- Education
- Emmy® Award Winning
- Entertainment
- Explainer LP
- Featured
- Finance
- Fitness
- Healthcare
- HIMSS
- InBound19
- Live Action
- Live Action LP
- Manufacturing
- Marketing
- Motion Graphics LP
- Software + Tech
- The Drip
- Uncategorized
- Video Marketing
- What We Do Bit Of Both
- What We Do Live Action
5 Ridiculously Easy Ways to Use Google Analytics
July 7, 2015

Google Analytics offers a ton of data to make decisions with. It can tell you where your website users are from, where they are clicking, how they are using your site and it can tell you what content isn’t doing so hot. What’s even better, is that Google offers its analytics to large and small businesses absolutely free.
If you’re not trained in Google Analytics (GA), making sense of the program is daunting, even horrifying. The majority of small business owners doesn’t even take the time to learn it because it’s all so overwhelming. Well, don’t panic. Here are 5 ridiculously easy (some even automated) ways to use Google Analytics.
1. Set Custom Alerts
You may be thinking you have to check analytics every day in order to get the benefits from it. Good news! This does not have to be the case. By setting an alert, you’ll receive a notification via email or text when a specific metric rises or falls drastically.
To do this go to Admin > Custom Alerts > New Alert
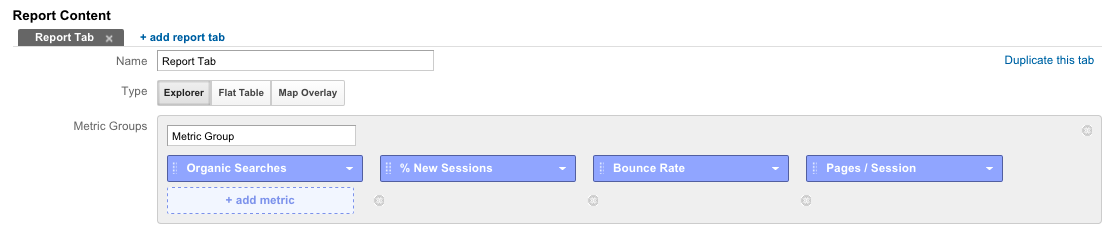
 The Reports Tab is if you want more than one report in your email. This is great if you want to track important data, but the metrics are not specifically in your overall goals. For example, geo locations.
Report Type is how you want the report laid out. Explorer gives you a trend chart in your report as well as a table of data. Flat Table is, well, a table of data. Map Overlay gives you an image and a chart of where your audience is coming from.
Here we are! Click the light blue “+ add metric” button to start selecting the data you’d like to receive.
When I first encountered Dimension Drilldown, I did one of those “You’ve got to be kidding me” sighs. I promise it’s not as scary as it looks. Hopefully, you’re still with me.
Dimension Drilldown is to further break down the metrics you’ve identified above. Say I want to track which browser my users are using. I can establish that in Dimension Drilldown.
Filters take the drill down even one step further. To run with our previous example, if you’re tracking which browsers your users are interacting with, filters allow you to segment mobile traffic and mobile data depending on which browser the user is using.
If you hover over each landing page you can quickly see the number of sessions, bounce rate and where the user went to next. The Behavior Flow chart helps understand how your site is using more so from the navigability standpoint.
There are way to optimize the landing page’s experience (a high bounce rate tells you users are having a less than pleasant experience), so think in terms of copy and visuals here, but the bigger picture to take away from the Behavior Flow chart is how easily the user is navigating through your site and if they are going in the direction you want them to. To find your Behavior Flow chart head to Behavior > Behavior Flow.
The percentages all the way to the right make no sense to me! By clicking the grid icon in the top right corner of the chart, I could easily see and understand the data. Now, it should look like this.
Thanks to Moz, we know that:
The Reports Tab is if you want more than one report in your email. This is great if you want to track important data, but the metrics are not specifically in your overall goals. For example, geo locations.
Report Type is how you want the report laid out. Explorer gives you a trend chart in your report as well as a table of data. Flat Table is, well, a table of data. Map Overlay gives you an image and a chart of where your audience is coming from.
Here we are! Click the light blue “+ add metric” button to start selecting the data you’d like to receive.
When I first encountered Dimension Drilldown, I did one of those “You’ve got to be kidding me” sighs. I promise it’s not as scary as it looks. Hopefully, you’re still with me.
Dimension Drilldown is to further break down the metrics you’ve identified above. Say I want to track which browser my users are using. I can establish that in Dimension Drilldown.
Filters take the drill down even one step further. To run with our previous example, if you’re tracking which browsers your users are interacting with, filters allow you to segment mobile traffic and mobile data depending on which browser the user is using.
If you hover over each landing page you can quickly see the number of sessions, bounce rate and where the user went to next. The Behavior Flow chart helps understand how your site is using more so from the navigability standpoint.
There are way to optimize the landing page’s experience (a high bounce rate tells you users are having a less than pleasant experience), so think in terms of copy and visuals here, but the bigger picture to take away from the Behavior Flow chart is how easily the user is navigating through your site and if they are going in the direction you want them to. To find your Behavior Flow chart head to Behavior > Behavior Flow.
The percentages all the way to the right make no sense to me! By clicking the grid icon in the top right corner of the chart, I could easily see and understand the data. Now, it should look like this.
Thanks to Moz, we know that:
2. Email Weekly Reports
Different marketers like different metrics, but there are some industry norms you’ll want to monitor. Generally specific stats such as users, sessions, unique visitors, bounce rate and an acquisitions overview. Using GA, you can have these metrics emailed to you and your team either weekly or monthly. This is a very time-saving tool! To incorporate emailed reports go to Customization > New Custom Report. From here I’ll break down the report options. Naming of your report is very straight forward. You can get as specific or as broad as you’d like. Since I’m creating a report tracking Digital Brew’s overall Key Performance Indicators (KPIs), I think I’ll name it just that.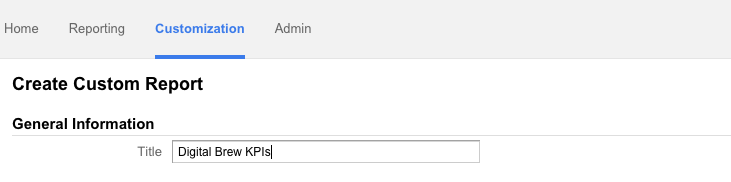 The Reports Tab is if you want more than one report in your email. This is great if you want to track important data, but the metrics are not specifically in your overall goals. For example, geo locations.
Report Type is how you want the report laid out. Explorer gives you a trend chart in your report as well as a table of data. Flat Table is, well, a table of data. Map Overlay gives you an image and a chart of where your audience is coming from.
Here we are! Click the light blue “+ add metric” button to start selecting the data you’d like to receive.
The Reports Tab is if you want more than one report in your email. This is great if you want to track important data, but the metrics are not specifically in your overall goals. For example, geo locations.
Report Type is how you want the report laid out. Explorer gives you a trend chart in your report as well as a table of data. Flat Table is, well, a table of data. Map Overlay gives you an image and a chart of where your audience is coming from.
Here we are! Click the light blue “+ add metric” button to start selecting the data you’d like to receive.
 When I first encountered Dimension Drilldown, I did one of those “You’ve got to be kidding me” sighs. I promise it’s not as scary as it looks. Hopefully, you’re still with me.
Dimension Drilldown is to further break down the metrics you’ve identified above. Say I want to track which browser my users are using. I can establish that in Dimension Drilldown.
Filters take the drill down even one step further. To run with our previous example, if you’re tracking which browsers your users are interacting with, filters allow you to segment mobile traffic and mobile data depending on which browser the user is using.
When I first encountered Dimension Drilldown, I did one of those “You’ve got to be kidding me” sighs. I promise it’s not as scary as it looks. Hopefully, you’re still with me.
Dimension Drilldown is to further break down the metrics you’ve identified above. Say I want to track which browser my users are using. I can establish that in Dimension Drilldown.
Filters take the drill down even one step further. To run with our previous example, if you’re tracking which browsers your users are interacting with, filters allow you to segment mobile traffic and mobile data depending on which browser the user is using.
3. Set Goals
GA makes tracking and analyzing goals very easy so you don’t have to spend hour gathering that data manually. Believe it or not, I actually used to do all this manually. It took days! Now I know better and am implementing Goals in Digital Brew’s analytics. The type of goals GA allows you to track is endless. Whether you want to monitor how many people are watching your video, reading testimonials or checking out your portfolio, GA can do the heavy lifting for you and track the necessary steps your visitors to taking to become a lead. To set up a new goal for your website is very simple. Go to Admin > Goals > New Goal. Google has a variety of templates ready for you to use or you can create a custom one. If you’d like a step by step video of how to do this, I found this video very helpful.4. Check out Behavior Flow
A data nerd’s paradise! If you’re not a data nerd, don’t panic. The Behavior Flow chart can seem overwhelming and complex at first glance, but take a deep breath and follow one line at a time.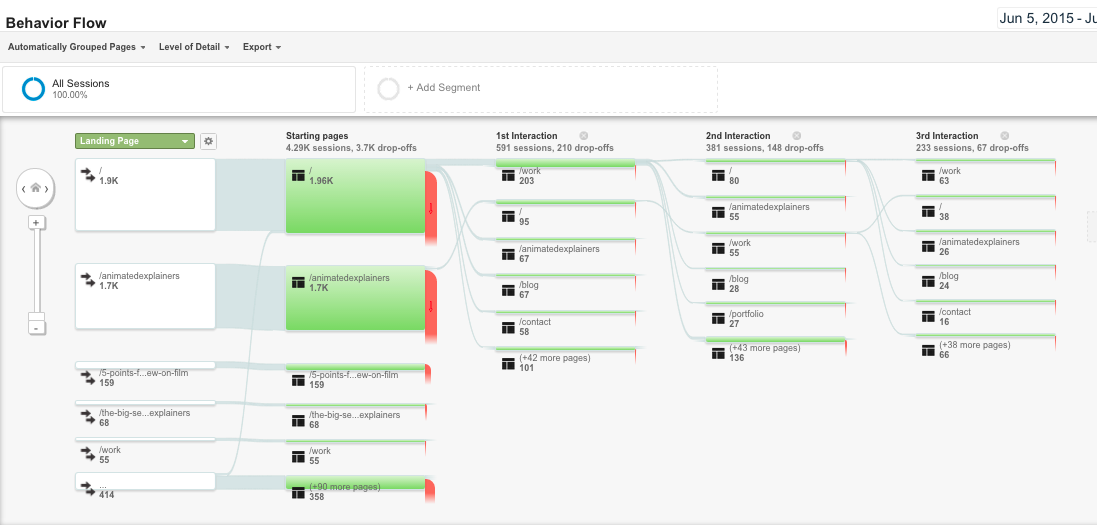 If you hover over each landing page you can quickly see the number of sessions, bounce rate and where the user went to next. The Behavior Flow chart helps understand how your site is using more so from the navigability standpoint.
There are way to optimize the landing page’s experience (a high bounce rate tells you users are having a less than pleasant experience), so think in terms of copy and visuals here, but the bigger picture to take away from the Behavior Flow chart is how easily the user is navigating through your site and if they are going in the direction you want them to. To find your Behavior Flow chart head to Behavior > Behavior Flow.
If you hover over each landing page you can quickly see the number of sessions, bounce rate and where the user went to next. The Behavior Flow chart helps understand how your site is using more so from the navigability standpoint.
There are way to optimize the landing page’s experience (a high bounce rate tells you users are having a less than pleasant experience), so think in terms of copy and visuals here, but the bigger picture to take away from the Behavior Flow chart is how easily the user is navigating through your site and if they are going in the direction you want them to. To find your Behavior Flow chart head to Behavior > Behavior Flow.
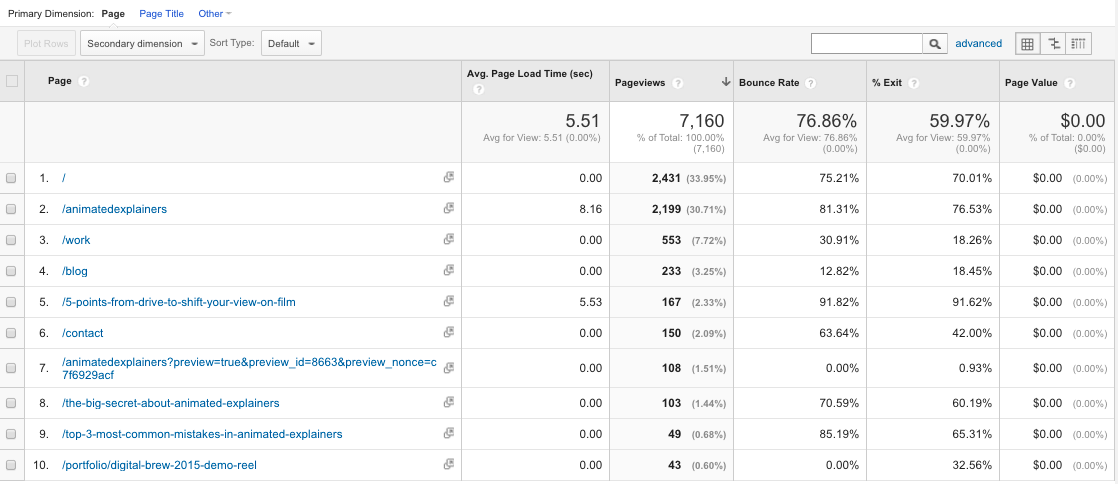
5. Measure Your Speed
The download speed of your website plays a factor in your SEO rankings. Who would have thought?! When I say download speed, I mean the speed in which your website downloads from the Internet. To get this data click Behavior > Site Speed > Overview. When I first pulled Digital Brew’s Site Speed report, I didn’t know how to make any sense of it. It looked like this.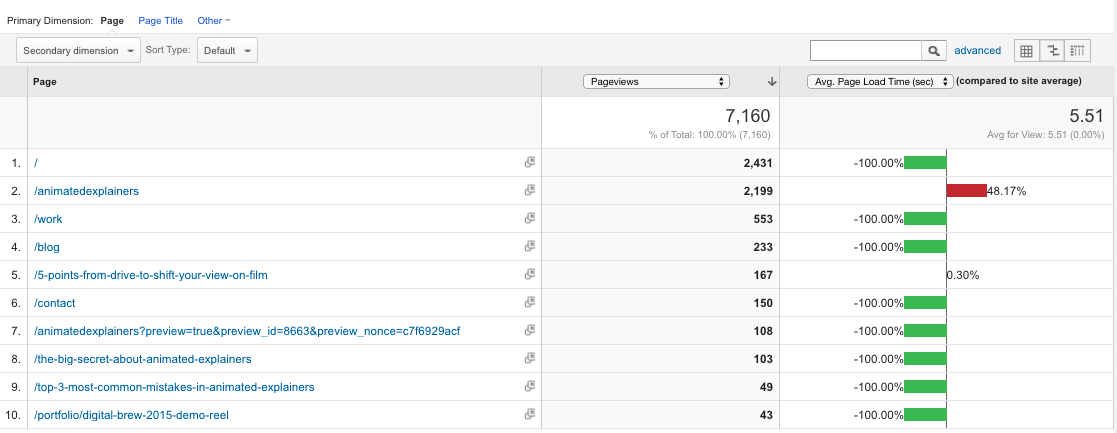 The percentages all the way to the right make no sense to me! By clicking the grid icon in the top right corner of the chart, I could easily see and understand the data. Now, it should look like this.
 Thanks to Moz, we know that:
- If your site loads in 5 seconds it is faster than approximately 25% of the web
- If your site loads in 2.9 seconds it is faster than approximately 50% of the web
- If your site loads in 1.7 seconds it is faster than approximately 75% of the web
- If your site loads in 0.8 seconds it is faster than approximately 94% of the web